Field LCP from 4.3s to 1.6s and a passing Core Web Vitals assessment, with no redesign
| Metric | Before | After | How measured |
|---|---|---|---|
| LCP, field data | 4.3s | 1.6s | Chrome UX Report, 28-day rolling, 90 days after launch |
| INP, field data | 340ms | 140ms | Chrome UX Report, 28-day rolling |
| PageSpeed, mobile lab | 61 | 94 | PageSpeed Insights, median of 5 runs |
| Core Web Vitals assessment | Failed | Passed | Search Console, origin level |
Almost every guide to fixing a slow Elementor site gives you the same three instructions: compress your images, install a caching plugin, move to better hosting. If you are reading this, you have probably done all three and your PageSpeed score has moved about four points.
That is the gap this slow Elementor site case study sits in. The client had already optimised images, already had a premium cache plugin, already paid for decent hosting. The site was still failing Core Web Vitals, and Search Console was saying so every month.
None of the seven things actually wrong with it appear on a standard checklist.
WordPress has a measurable performance problem as a platform. Recent Core Web Vitals data put WordPress at a 44% pass rate, behind Squarespace at 68%, Wix at 73% and Duda at 85%. WordPress came last.
That is not because WordPress is badly built. It is because WordPress lets you assemble anything, and most sites are assembled rather than designed. A page builder accelerates that: you get flexibility, and you get a runtime that has to support every feature it offers whether your page uses them or not.
The standard advice works right up until it does not. Images and caching address payload and repeat delivery. They do nothing about render-blocking CSS, an LCP element the browser cannot discover early, or a main thread busy for 300 milliseconds after someone taps a button.
So a slow Elementor site that has already had the easy work done is usually stuck on things you cannot see from a score. You need to know what the score is measuring, and more importantly what it is not.
The slow Elementor site in question belonged to a professional services firm, roughly forty pages, built in Elementor Pro on a well-regarded host. The previous developer had done real work: images were compressed and converted to WebP, a premium cache plugin was installed and active, a CDN was in front of it.
Lab PageSpeed on desktop was 95. Everyone had reasonably concluded the site was fine.
Field data said otherwise. Real visitors on real phones were seeing a 4.3 second Largest Contentful Paint, and Search Console had the whole origin marked as failing the Core Web Vitals assessment. Mobile lab score was 61.
That gap between 95 and reality is the single most common reason a slow Elementor site goes unfixed for months. A lab run uses a fast simulated connection and a powerful test device. Your customers have neither.

Elementor ships a set of performance features under Settings, and on almost every slow Elementor site I inherit, every one of them is off. Optimized Asset Loading serves only the CSS and JS for widgets actually present on a page, instead of the full library. Element Caching stores rendered HTML for static sections. Improved CSS Loading defers non-critical styles so they stop blocking the first render.
These are switches. They cost nothing, they are in the plugin you already pay for, and turning on the right combination was worth more on this site than the cache plugin had been.
The caveat is that they need testing after enabling, because Optimized Asset Loading occasionally strips CSS a third-party addon was relying on. That is a ten-minute check, not a reason to leave them off.
On this slow Elementor site the hero used a container background image rather than an img tag. Visually identical, and completely different to a browser.
A real image can be preloaded, given fetchpriority="high", and discovered by the preload scanner before CSS finishes parsing. A background image cannot be discovered until the stylesheet has been downloaded, parsed and matched to the element. On mobile that is a second of delay before the browser even knows the file exists.
This is the single most common LCP problem on a slow Elementor site, and it is invisible in every report. PageSpeed tells you the LCP is slow. It does not tell you the element is undiscoverable.
The fix was a real image element in the hero, with the preload and priority hints set.
Elementor generates per-page CSS files and regenerates them on a schedule. The cache plugin was preloading pages directly from the database rather than by visiting them, so it cached pages whose CSS files had just been flushed.
The symptom is a page that occasionally renders unstyled for a visitor and looks perfect when you check it. Intermittent, unreproducible, and enormously frustrating to chase.
The fix is setting Elementor’s CSS Print Method to Internal Embedding when a page cache is preloading, which Elementor‘s own support recommends for exactly this situation. Almost nobody knows the setting exists.
Fonts are the quietest tax on a slow Elementor site. Two families, four weights each, requested from Google’s servers. That is a DNS lookup, a connection, a TLS handshake and two round trips before a single character renders.
Self-hosted, subset to the characters actually used, preloaded, and cut to the two weights the design genuinely needed. Also a GDPR improvement, since requesting fonts from Google sends your visitor’s IP to Google.
Addon packs are the other reliable culprit behind a slow Elementor site. Three were installed here for a handful of widgets used on two pages. Each one enqueued its full stylesheet and script bundle sitewide.
Two packs were removed entirely after rebuilding their widgets natively. The third was scoped so its assets load only where its widgets appear.
Third-party scripts turn a merely slow Elementor site into an unresponsive one. Tag Manager, a chat widget and a booking embed were all loading on page load, all executing before anyone had interacted with anything. INP measured 340 milliseconds, well into the failing range.
The chat widget moved behind a facade: a lightweight button that only downloads the real widget when someone clicks it. Tag Manager was deferred. The booking embed now loads on the page that uses it rather than sitewide.
The previous developer had been optimising against a desktop lab score, which is why it reached 95 while real users waited four seconds.
Every change in this engagement was measured against Chrome UX Report field data and a throttled mid-range Android. That is not a detail. Optimising a slow Elementor site against the wrong measurement is how six months of work produces no result anybody can feel.
The slow Elementor site is no longer slow. Field LCP went from 4.3 seconds to 1.6. INP came down from 340 milliseconds to 140. The mobile lab score moved from 61 to 94, and the origin went from failing the Core Web Vitals assessment to passing it.
No redesign. The client kept their Elementor build, their theme and their layout. What changed was what loads, in what order, and how it is measured.
Every one of those seven fixes is public knowledge. What is rarely written down is the sequence, and on a slow Elementor site the sequence is most of the value.
Enable Elementor performance features first, because they change what the other measurements mean. Optimising CSS before you have told Elementor to stop loading CSS for widgets you never use is optimising the wrong file.
Fix the LCP element second. It is usually the largest single number, and everything else becomes easier to judge once the headline metric stops dominating the report.
Fonts and third-party scripts third, since those are independent of the builder and will not be undone by the earlier changes.
Cache configuration last. Caching a broken page serves the broken page faster, and a cache configured before the underlying work is finished has to be reconfigured afterwards anyway.
Doing this in the wrong order is why people report spending weeks on a slow Elementor site and moving the score by single digits. The work was not wrong. The sequence was.
Run this before hiring anyone, including me. It tells you whether your problem is the four-point kind or the structural kind.
Most people running this on a slow Elementor site find two or three of the seven within ten minutes. A slow Elementor site rarely has one cause.
Not every slow Elementor site is slow because of Elementor. Worth saying plainly, because the internet is confident that page builders are the whole story.
Elementor adds overhead. So does every builder, and so does most of what people install alongside it. But I have audited plenty of sites where the builder was fine and the real problem was a database nobody had cleaned in four years, a shared host struggling at its limits, or a single plugin running an uncached external API call on every page load.
If your time to first byte is over 800 milliseconds, stop reading about CSS. Your problem is server-side and no amount of front-end work will fix it. Field data will tell you which situation you are in before you spend anything.
And if you are considering a move off Elementor entirely, that is sometimes right and it is a bigger decision than a performance one. A rebuild in Bricks costs more than fixing what you have, and only pays back if you were going to redesign anyway.
Because images address payload and most remaining problems are about discovery and timing. A slow Elementor site with perfectly compressed images can still fail if the hero is a background image the browser cannot find early, or if CSS is blocking the first render. Compression fixes weight, not order.
Rarely, and it is the most commonly suggested non-fix for a slow Elementor site. If you are already on Hello Elementor or a similar minimal theme, the theme is contributing almost nothing and swapping it changes almost nothing. The weight comes from the builder runtime, addon packs and third-party scripts.
Yes, measurably, on a like-for-like build. Whether that matters depends on the gap between where you are and where you need to be. A well-configured Elementor site passes Core Web Vitals comfortably. If yours does not, configuration is the cheaper fix to try first.
You are reading the lab score. Lab runs simulate a fast connection on a powerful device. Scroll up to the field data section, which is what your actual visitors experienced over the last 28 days, and which is what Google uses for the Core Web Vitals assessment.
One to two weeks for a site of this size, quoted fixed-price after an audit. This is standard speed optimization work on an Elementor build. The audit comes first because sometimes the answer is that your hosting is the bottleneck, and that is a different and cheaper conversation.
No. Everything in this case study happened behind the interface. The client’s layout, content and design are unchanged. Visitors notice only that it is fast.
Run the ten-minute slow Elementor site diagnostic above first. If it turns up nothing, send me the URL through the contact page or book a free call, and I will read your field data, name the LCP element, and tell you which of the seven you are dealing with.
If the answer is your hosting rather than your build, I will say so, and that saves you a fortnight.

Modern fashion e-commerce platform specializing in ethnic wear with seasonal sales, discount logic, and responsive shopping layouts.
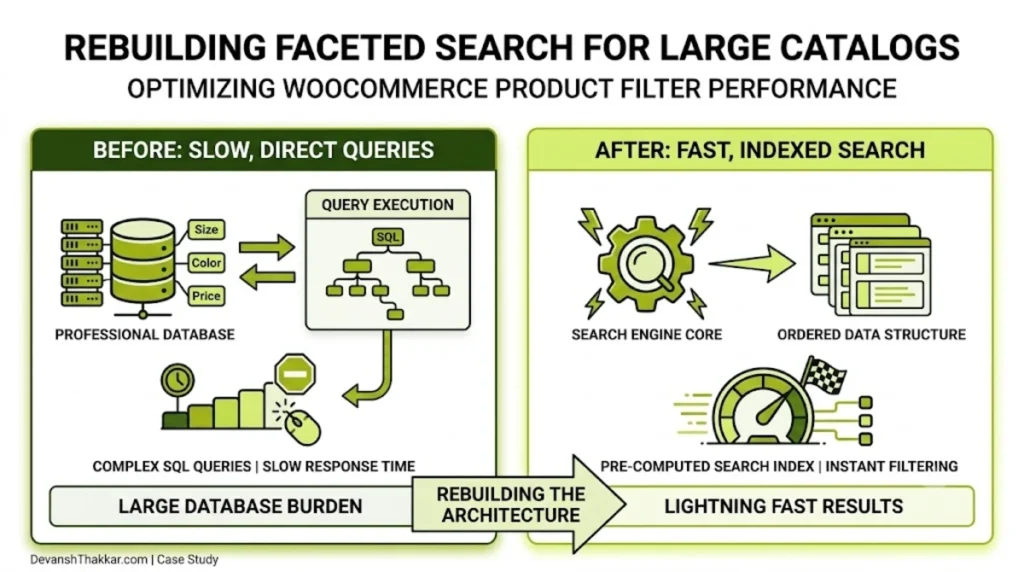
Facets that return in under 300ms, and a crawl budget no longer spent on filter permutations

Luxury real estate platform showcasing premium villas and properties in Punta Cana with dynamic listings and multi-language support.
Free 30-minute call. Tell me what is going wrong and you get a fixed-price quote within 48 hours. If a smaller fix would do, I will say so.