


- To fix it, break up long JavaScript tasks and tame third-party scripts, since blocking the main thread is what makes a page feel unresponsive.
- The metric replaced FID in March 2024 and measures every interaction across the whole visit, not just the first, so it is far stricter.
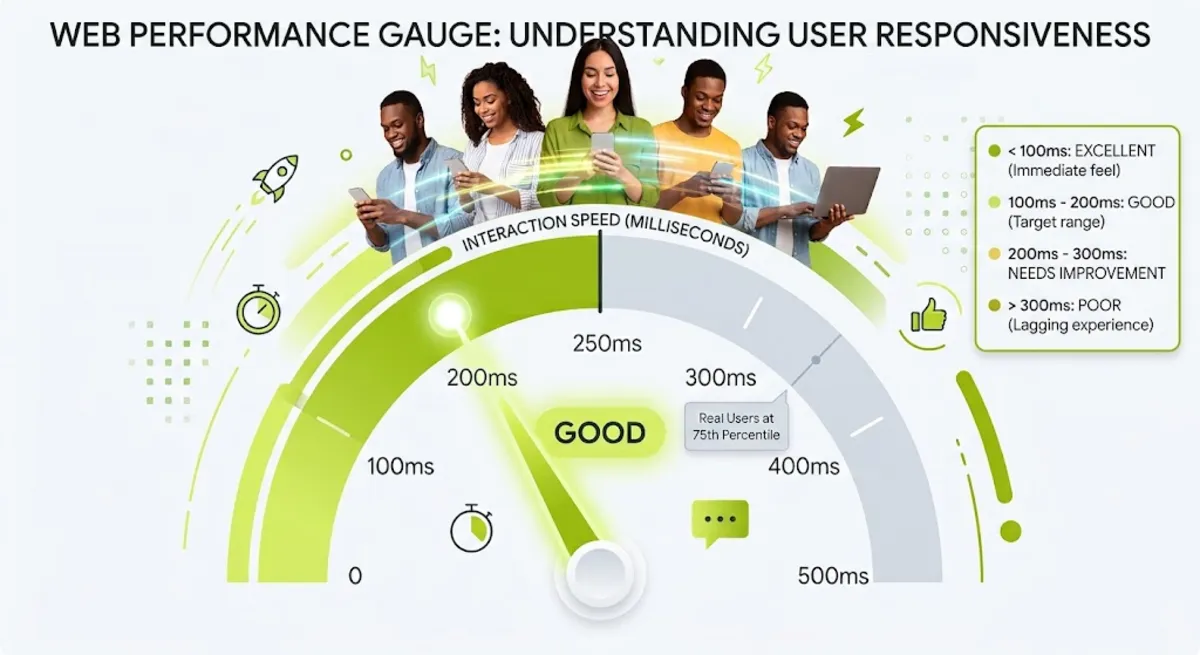
- A good INP is 200 milliseconds or less at the 75th percentile of real users, measured separately for mobile and desktop.
- The single biggest fix is yielding to the main thread between chunks of work, so the browser can respond to input.
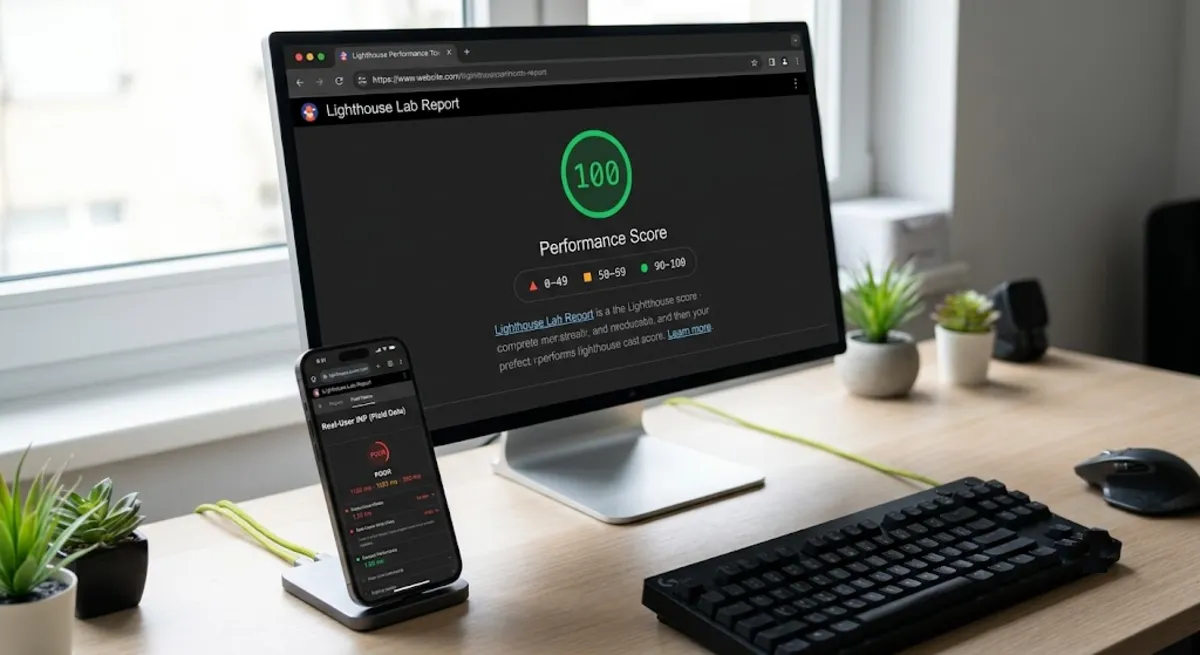
- It is a field metric that does not appear in Lighthouse, so you must measure on real users, not a lab score.
To fix a poor Core Web Vitals INP score, you break up long JavaScript tasks, tame heavy third-party scripts, and yield to the main thread so the browser can respond to interactions quickly. It measures how fast your page reacts to every click, tap, and keypress, and the enemy is almost always blocking JavaScript. This guide shows exactly what to fix, and in what order.
After fixing Core Web Vitals for clients in 15+ countries, here is the reality about this metric. It is the hardest of the three vitals to pass, and the one most sites fail right now, because it exposes exactly the heavy JavaScript that older metrics let slide. The good news: once you understand what it captures, the fixes are concrete and repeatable. Here is the whole playbook.
What Is INP, and Why It Replaced FID
INP, or Interaction to Next Paint, is the Core Web Vital that measures how quickly your page responds visually after a user interacts with it. It replaced First Input Delay in March 2024, and the difference is what matters: FID only measured the delay before the very first interaction, while the newer metric measures the full latency of every interaction throughout the whole visit.
Every interaction it measures has three phases, and knowing them tells you where to look:
- Input delay. The time the browser waits while the main thread finishes other work before it can start handling your interaction.
- Processing time. The time your event handlers take to run their JavaScript.
- Presentation delay. The time the browser takes to lay out and paint the visual update on screen.
Per web.dev’s INP documentation, the metric tracks clicks, taps, and keyboard interactions, but not scrolling or hovering. This shift is why so many sites suddenly fail the metric: a page could pass FID with a fast first click yet feel sluggish on every menu, filter, and form after that.
Pro tip: Stop thinking of responsiveness as a page-load problem. Around 90 percent of a user’s time on a page happens after it loads, during interactions. The metric measures that entire experience, so optimizing only your initial load, the old FID habit, leaves most of the problem untouched.
Before you fix it, you need to know what number you are aiming for.
What Counts as a Good INP Score
A good score is 200 milliseconds or less, measured at the 75th percentile of real user visits. Google uses a simple traffic-light scale, and because it is measured on real users, hitting the target means most of your visitors, not just some, get a fast response.
| INP score | Rating | What it means |
|---|---|---|
| 200ms or less | Good | The page feels responsive to most users. |
| 200ms to 500ms | Needs improvement | Noticeable lag on interactions for many users. |
| Over 500ms | Poor | The page feels sluggish and unresponsive. |
Two details matter here. First, scores are measured separately for mobile and desktop, so your mobile responsiveness affects mobile rankings and your desktop responsiveness affects desktop rankings. Second, the target is the 75th percentile, meaning at least 75 percent of visits must respond in under 200 milliseconds. That is a demanding bar, which is why a large share of sites still fail it. So what is dragging those scores down?
What Causes a Poor INP Score
A poor score is almost always caused by JavaScript blocking the browser’s main thread, so it cannot respond to interactions in time. The main thread handles one task at a time, and any task over 50 milliseconds is a long task that freezes the page during that window.
The usual culprits behind a bad score:
- Long JavaScript tasks. Heavy functions that run for more than 50 milliseconds and block everything else while they do.
- Third-party scripts. Chat widgets, analytics, A/B testing tools, and ad scripts, each competing for main-thread time. These are the most common cause.
- Inefficient event handlers. Handlers that do heavy work synchronously the moment a user clicks or types.
- A large or complex DOM. A huge element tree makes every style and layout recalculation more expensive.
- Heavy framework hydration. Large client-side JavaScript bundles that spike the main thread as the page becomes interactive.
Knowing the causes, here is how to fix them, starting with the change that moves the number most.
How to Fix INP, in Order of Impact
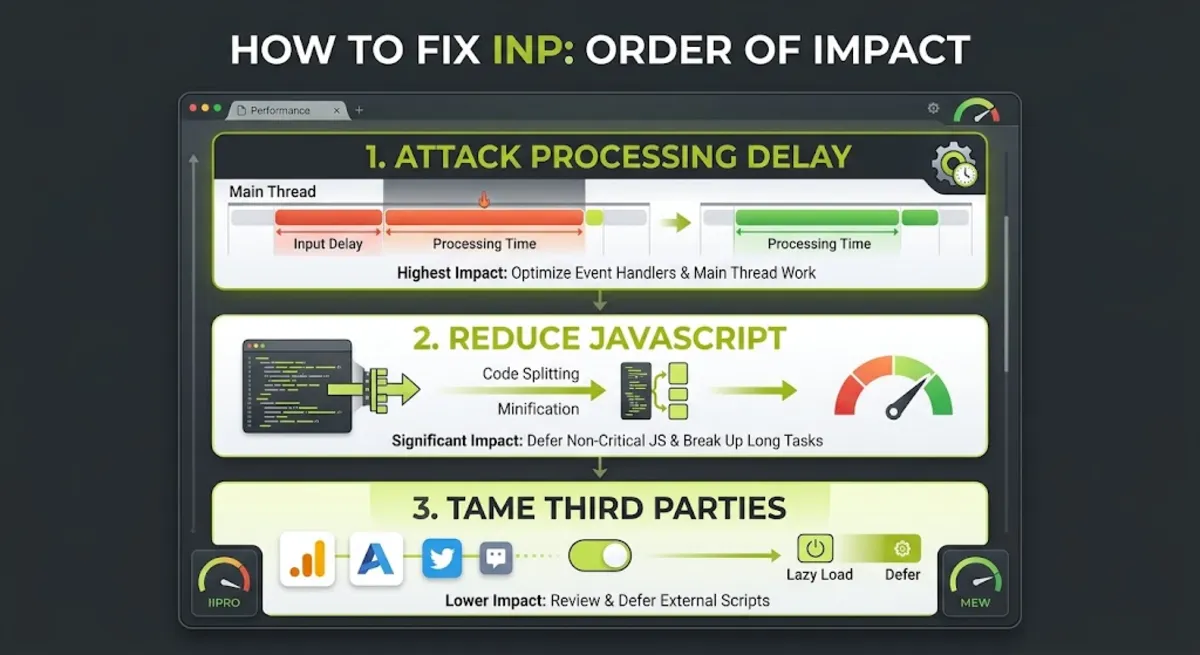
You fix a poor score by attacking the processing phase first, since that is where most of the delay lives, then reducing JavaScript and taming third parties. Work in order of impact, because the first two fixes typically deliver the bulk of the improvement.
| Priority | Fix | Why it works |
|---|---|---|
| 1 | Break up long tasks | Yield to the main thread between chunks so the browser can respond to input mid-work. |
| 2 | Ship less JavaScript | Code-split, lazy-load below-the-fold widgets, and remove unused scripts and bloated plugins. |
| 3 | Tame third-party scripts | Defer or lazy-load chat, analytics, and A/B tools. Load them after the page is interactive. |
| 4 | Lighten event handlers | Do minimal work synchronously. Defer or offload filtering, sorting, and logging. |
| 5 | Shrink the DOM | A smaller, flatter tree makes every layout and paint after an interaction cheaper. |
For INP, the highest-leverage technique is yielding to the main thread. When a long task is running, the browser cannot respond, so you break the work into chunks and hand control back between them. The modern way is the scheduler.yield API, which resumes your work at a user-visible priority, with setTimeout or requestIdleCallback as fallbacks. The pattern to aim for: event handlers that do almost nothing synchronously, with anything expensive yielded, deferred, or offloaded to a web worker.
Pro tip: The fastest real-world win is usually not in your own code, it is deferring third-party scripts. Load the chat widget, analytics, and A/B tools after the page becomes interactive, or on first interaction, rather than up front. On many sites that single change moves the score from red to green.
You cannot fix what you cannot see, though, so measurement comes next.
How to Measure and Diagnose INP
You measure INP with real-user field data, because it is a field metric that does not appear in lab tools like Lighthouse. That single fact trips up more teams than any other. Per web.dev’s optimization guide, the reliable path is checking your real-user field data, then using lab tools to reproduce and fix the specific slow interactions you find.
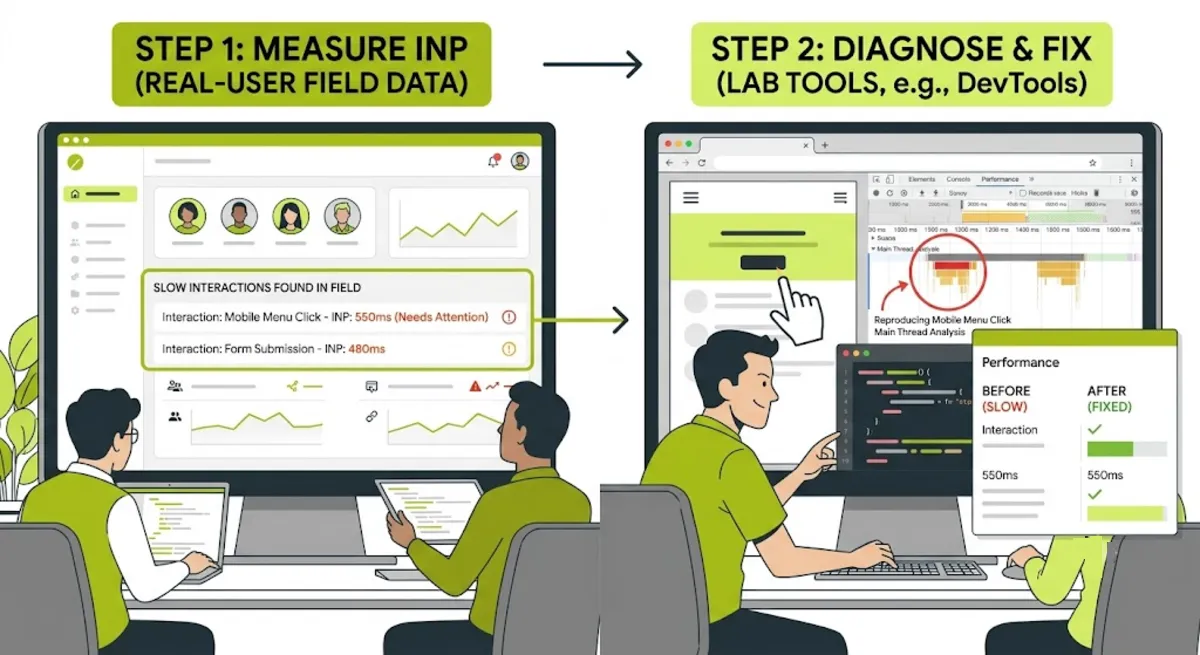
The tools that matter, in order of use:
- PageSpeed Insights. Shows your real-user score from the Chrome User Experience Report, the same data Google ranks on.
- Search Console. The Core Web Vitals report flags which page groups are failing at scale.
- Real user monitoring. A RUM tool gives the context field summaries lack, showing which interactions are slow and where.
- Chrome DevTools. Record an interaction in the Performance panel and look for tasks over 50 milliseconds blocking the main thread.
- The Web Vitals extension. Shows the metric live as you click around a page during development.
The key measurement rule: per Google’s Core Web Vitals guidance, INP is judged on real users at the 75th percentile. A perfect Lighthouse score means nothing here, because Lighthouse cannot measure INP at all. Always start from field data.
Measure first, fix in order, and re-check the field data. Here is where people go wrong.
Failing INP and not sure which script is the culprit?
I diagnose and fix Core Web Vitals INP, from long tasks to third-party bloat, so your pages pass on real users. See my WordPress and SEO service.
What Most People Get Wrong
The biggest mistake with INP is trusting a green Lighthouse score. This is a field metric, measured on real users, and it simply does not appear in Lighthouse, which runs in a lab. So a perfect lab score can sit right next to a failing real-user result, and teams celebrate a number that has nothing to do with the metric Google is actually ranking on.
Here is the observation from client work. The second big mistake is assuming the metric is just FID renamed, so the old fixes still apply. They do not. FID measured only the first interaction’s input delay, and most sites passed it easily. It measures every interaction’s full lifecycle, including processing and rendering, across the whole session. That is a far harder bar, and it is exactly why sites that looked fine for years are suddenly in the red.
The third trap is blaming your own code first. On most sites, the largest cost comes from third-party scripts, chat widgets, tag managers, ad and testing tools, doing work on the main thread. Optimizing your own handlers while a heavy third-party script runs unchecked is polishing the wrong thing. Audit the third parties before you rewrite your own functions.
When your score is stuck in the red and the cause is buried in third-party or framework code, that is where an experienced performance fix pays for itself.
Stuck in the red on INP no matter what you try?
I profile the real slow interactions, break up the long tasks, and tame the scripts dragging your INP down. See my WordPress and SEO service or book a free call.
Frequently Asked Questions
What is a good INP score?
A good score is 200 milliseconds or less, at the 75th percentile of real user visits. Between 200 and 500 milliseconds needs improvement, and over 500 milliseconds is poor. Scores are measured separately for mobile and desktop.
How is it different from FID?
FID measured only the delay before the first interaction on a page. The newer metric measures the full latency, input delay, processing, and rendering, of every interaction across the whole visit, then reports the slowest. This makes it far stricter and more representative, which is why many sites that passed FID now fail.
Why is my score so high?
Almost always because JavaScript is blocking the main thread when users interact. The usual causes are long JavaScript tasks over 50 milliseconds, heavy third-party scripts like chat and analytics, inefficient event handlers, a large DOM, and heavy framework hydration.
How do I fix a poor score?
Break up long tasks by yielding to the main thread with the scheduler.yield API, ship less JavaScript through code-splitting and lazy-loading, and defer third-party scripts until after the page is interactive. Then lighten event handlers and shrink the DOM.
Why does my score fail when Lighthouse says it is good?
Because Lighthouse cannot measure it. It runs in a lab and the metric is a field measure based on real user interactions, so it never appears in a Lighthouse report. A green lab score can sit next to a failing real-user score. Always check field data in PageSpeed Insights or Search Console instead.
Do third-party scripts affect responsiveness?
Heavily. Chat widgets, analytics, tag managers, ads, and A/B testing tools all compete for time on the main thread, and each can add significant delay to every interaction. On many sites they are the single largest cost. Deferring or lazy-loading them until after the page is interactive is often the fastest fix.
Is INP a Google ranking factor?
Yes, as part of Core Web Vitals, which are a confirmed page-experience ranking signal. It acts as a tie-breaker between pages of similar relevance rather than an override of content quality. Its bigger practical value is user experience, since responsive pages reduce bounce and improve conversions alongside rankings.
Should I hire someone to fix INP?
Consider it when your INP is stuck in the red, the cause is buried in third-party or framework code, or you lack the tooling to profile real interactions. Diagnosing and fixing INP is deep technical work. My WordPress and SEO service covers full Core Web Vitals optimization.
Conclusion
Fixing a Core Web Vitals INP score comes down to one idea, stop blocking the main thread. Break up long JavaScript tasks by yielding between chunks, ship less JavaScript, and defer the third-party scripts that quietly hog every interaction. Aim for 200 milliseconds or less at the 75th percentile, measure it on real users rather than a lab tool, and remember the metric is far stricter than the FID it replaced. Start today by running your key pages through PageSpeed Insights, reading your real-user score, and recording an interaction in the Performance panel to find the long tasks. Fix those first, and the number will move.
Ready to turn your INP green for good?
I fix Core Web Vitals INP at the source, so your pages feel instant and pass on real users. Book a free call or browse my recent project portfolio.
This article was last reviewed and updated in June 2026 to reflect current Core Web Vitals thresholds and INP optimization techniques.