- Elementor Core Web Vitals fail most on Largest Contentful Paint, usually because of a heavy hero image and slow server response.
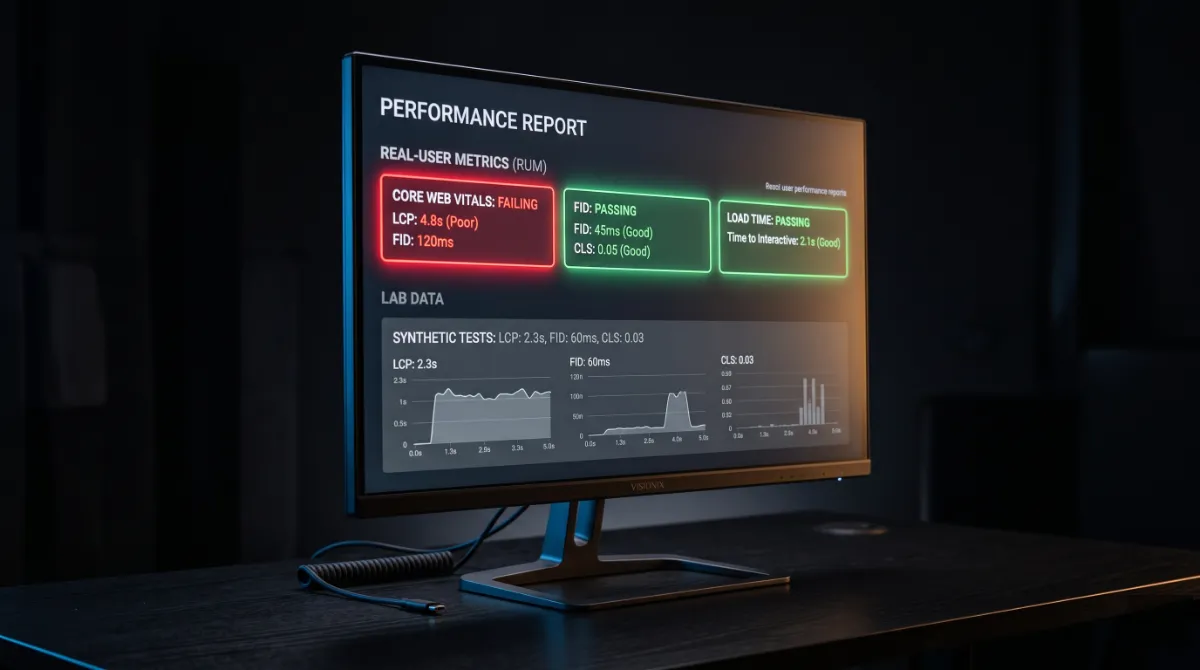
- The three targets in 2026 are LCP under 2.5 seconds, INP under 200 milliseconds, and CLS under 0.1, measured on real visitors.
- INP is now the hardest metric to pass, and on Elementor it fails because popups, sliders, and addon scripts overload the main thread.
- CLS is the cheapest fix: set width and height on every image, and reserve space for fonts, embeds, and ads.
- Fix the metric that is actually failing in your field data, not the one Lighthouse makes easy to chase.
Elementor Core Web Vitals problems almost always trace to three fixable metrics: a slow Largest Contentful Paint, a laggy Interaction to Next Paint, and a jumpy Cumulative Layout Shift. Fix each one by optimizing your hero image, trimming and delaying JavaScript, and reserving space for every element that loads. Work them in priority order and your scores turn green.
After optimizing Elementor sites for clients in 15+ countries, I can tell you the metrics rarely fail at random. Each Elementor Core Web Vitals metric maps to a specific, visible part of your page, and once you know which element is dragging which metric, the fix is fast. So instead of chasing a single Lighthouse number, diagnose by metric. That is the entire idea behind the system below: find the failing vital, map it to the element, apply the matched fix.
What Are Elementor Core Web Vitals?
Elementor Core Web Vitals are Google’s three page-experience metrics measured on an Elementor-built site: Largest Contentful Paint for loading, Interaction to Next Paint for responsiveness, and Cumulative Layout Shift for visual stability. Your Elementor Core Web Vitals matter because Google uses them as a ranking signal and judges them on real visitor data, not your laptop. A page only passes when 75 percent of real visits hit the good threshold on all three metrics at once.
Here are the 2026 targets you are aiming for:
- LCP under 2.5 seconds (good), 2.5 to 4.0 needs work, over 4.0 is poor.
- INP under 200 milliseconds (good), 200 to 500 needs work, over 500 is poor.
- CLS under 0.1 (good), 0.1 to 0.25 needs work, over 0.25 is poor.
One key 2026 change shapes everything below. Interaction to Next Paint replaced First Input Delay as the official responsiveness metric on March 12, 2024, and it is far stricter. Roughly 43 percent of sites still fail it, which makes INP the most commonly failed vital on the web today. Knowing your scores by metric is the first step to any Elementor Core Web Vitals fix.
Pro tip: A “good” score on one metric means nothing if another is red. Google needs all three in the good band, at the 75th percentile, before a URL group passes.
Before changing anything, you need to see which metric is actually failing.
How to Measure Your Scores First
Measure your Elementor Core Web Vitals with field data before you touch a single setting, because field data reflects real users while lab tools only simulate. Start at PageSpeed Insights and read the top section first, the real-user data from the Chrome User Experience Report, not the lab score below it. That field panel tells you which of the three Elementor Core Web Vitals is in the red on real devices.
Use three tools together for a complete Elementor Core Web Vitals picture. PageSpeed Insights gives you the per-metric field verdict. Google Search Console groups similar URLs, which is powerful on Elementor sites because one slow template can drag down dozens of pages at once. Then Chrome DevTools, in the Performance and Lighthouse tabs, helps you find the exact cause once you know the symptom. This three-tool habit is the foundation of the Elementor Vitals Triage I use on every site: read the field data, map the failing metric to the visible element, then apply the matched fix.
With your failing metric identified, start with whichever vital is in the red. For most Elementor sites, that is LCP.
Fix LCP: Speed Up the Largest Contentful Paint
To improve your Elementor Core Web Vitals at the loading level, fix the Largest Contentful Paint element, which is almost always the hero image or main heading in the first viewport. LCP fails on Elementor because of oversized hero images, sliders, video sections, and slow server response. WordPress sites in particular struggle with this Elementor Core Web Vitals metric: by CrUX data, only around a third have good server response time, and a slow server delays everything.

Work through these LCP fixes in order:
- Compress and convert the hero image to WebP or AVIF, targeting well under 200 KB. This is the single biggest LCP win on most pages.
- Never lazy-load the hero. Enable Elementor’s Optimized Image Loading so the LCP image gets priority while images below the fold stay lazy.
- Speed up the server. Add caching (LiteSpeed Cache on Hostinger, or WP Rocket elsewhere) and turn on Element Caching so Elementor stops re-rendering on every visit.
- Cut render-blocking code with Improved CSS Loading, and preload your main font with
font-display: swapif the LCP element is text.
With loading handled, the next metric is the one most Elementor sites quietly fail.
Fix INP: Make Elementor Respond Instantly
The hardest Elementor Core Web Vitals metric to fix is Interaction to Next Paint, because it is about JavaScript, not images. Among your Elementor Core Web Vitals, INP measures how fast your page responds to clicks, taps, and key presses, and it reports your worst interaction across the whole visit. On Elementor, INP fails because popups, sticky headers, animated counters, tabbed content, filters, mega menus, addon widgets, and third-party tracking scripts all pile work onto the main thread.

Any task that runs longer than 50 milliseconds blocks the main thread, and stacked tasks are why buttons feel dead. Google’s own guide to optimizing INP centers on three moves: avoid unnecessary JavaScript, break up long tasks, and avoid large rendering updates. On a builder like Elementor, you apply those by trimming what runs.
Here is how to bring INP down:
- Delay non-critical JavaScript in your cache plugin so scripts wait until the user interacts.
- Cut the heavy widgets. Limit animated counters, motion effects, and addon-heavy sections, especially above the fold.
- Audit third-party scripts. Chat widgets, trackers, and pixels often cost more INP than anything Elementor adds.
- Enable Improved Asset Loading so libraries like dialog and lightbox load only on pages that use them, and move to Flexbox Containers to shrink the DOM the main thread has to manage. These Elementor performance features are reversible and need no rebuild.
Pro tip: Most clients “fixed the images” and still failed Core Web Vitals, because the real culprit was INP. If your LCP is green but you still fail, your JavaScript is the problem, not your media.
Once the page responds quickly, the last metric is the cheapest one to fix.
Fix CLS: Stop the Layout From Jumping
The easiest Elementor Core Web Vitals win is Cumulative Layout Shift, which measures how much your content jumps as the page loads. This Elementor Core Web Vitals metric makes a site feel amateur: buttons slide under thumbs, text reflows, and ads push content down. On Elementor it fails because of images without set dimensions, late-loading custom fonts, and embeds or ads that load with no reserved space.

Three fixes clear almost all CLS on an Elementor site. First, give every image, video, and iframe explicit width and height so the browser reserves the space before it loads. Second, reserve space for dynamic content by adding a min-height to containers that hold embeds, ads, or a third-party chat widget. Third, load fonts with font-display: swap and self-host them, so a late font swap does not reflow your headings.
With all three metrics handled, it helps to know where the popular advice goes wrong.
Worked through every metric and your field data still will not pass?
Some failures hide in a theme, a plugin conflict, or a hosting limit. I diagnose and fix slow Elementor sites end to end. See my WordPress development service.
What Most Guides Get Wrong
Most Elementor Core Web Vitals guides tell you to chase a green Lighthouse score in the lab. That is the wrong scoreboard. Google ranks your Elementor Core Web Vitals on field data from real users at the 75th percentile, collected over a 28-day window, and your lab score on fast office wifi can be an order of magnitude better than what your visitors actually feel on a mid-range phone.
The counter-intuitive truth is to fix the metric that is actually failing, not the one that feels satisfying to optimize. People spend a weekend compressing images while their Elementor Core Web Vitals stay red because INP quietly tanks from a popup script. Pull your field data first, find the worst metric, and start there. That single discipline beats any generic checklist.
When the failing metric is INP, or when the cause hides in a plugin or template, that is the moment a developer earns their fee, because the fix is architectural, not a toggle. Get the diagnosis right and you stop wasting effort on the wrong vital.
INP failing and you are not sure which script is the cause?
That is the hardest vital to fix alone. If you would rather hand it off, I audit and optimize Elementor sites until all three metrics pass. See my WordPress development service or book a free call.
Frequently Asked Questions
Why does Elementor fail Core Web Vitals?
Elementor adds extra CSS, JavaScript, and DOM wrappers on every page, which slows LCP and INP, and its widgets can shift the layout, hurting CLS. The good news is each cause is fixable with settings, image optimization, caching, and reserved space, without leaving Elementor.
What is a good Core Web Vitals score for an Elementor site?
Good Elementor Core Web Vitals in 2026 mean LCP under 2.5 seconds, INP under 200 milliseconds, and CLS under 0.1. Google measures these on real visitors at the 75th percentile, so 75 percent of your traffic must hit all three good thresholds at once for the page to pass.
How do I fix LCP on an Elementor site?
Optimize the LCP element, which is usually the hero image. Convert it to WebP or AVIF under 200 KB, never lazy-load it, and enable Elementor’s Optimized Image Loading. Then speed up your server with caching and Element Caching, since slow server response delays LCP the most on WordPress.
Why is my Elementor INP so high?
High INP comes from JavaScript blocking the main thread. On Elementor, popups, sticky headers, animated counters, filters, addon widgets, and third-party trackers are the usual offenders. Delay non-critical scripts, cut heavy widgets above the fold, and audit your tracking pixels to bring INP under 200 milliseconds.
How do I stop layout shift in Elementor?
Set explicit width and height on every image, video, and iframe so the browser reserves space before they load. Add a min-height to containers holding ads or embeds, and load fonts with font-display swap while self-hosting them. These three moves clear most CLS on an Elementor page.
Do Elementor’s performance features improve Core Web Vitals?
Yes. For Elementor Core Web Vitals, Optimized Image Loading helps LCP, Improved Asset Loading and Element Caching help INP and TTFB, and moving to Flexbox Containers trims the DOM that affects both INP and CLS. They are reversible and need no rebuild, so they are the safe first step in any vitals fix.
Should I trust my Lighthouse score or PageSpeed field data?
Trust the field data. Lighthouse is a lab simulation useful for diagnosis, but Google ranks on real-user field data from the Chrome User Experience Report at the 75th percentile. Always read the field panel at the top of PageSpeed Insights before judging whether a page actually passes.
When should I hire a professional for an Elementor Core Web Vitals fix?
Hire a professional when INP is the failing metric, when a plugin or template is the hidden cause, or when settings and caching are not enough. A developer reads your field data, finds the real bottleneck, and fixes it. My WordPress development service covers exactly this work.
Conclusion
An Elementor Core Web Vitals fix comes down to three metrics and one habit: speed up LCP by optimizing the hero and the server, lower INP by trimming and delaying JavaScript, and stop CLS by reserving space for everything that loads. Those three moves are the whole Elementor Core Web Vitals fix. The habit is to diagnose from real field data and fix the metric that is actually failing, not the one that is easy to chase. Start with your worst Elementor Core Web Vitals metric today, re-test after a few weeks, and bring in help when the cause is buried deeper than a setting.
Want all three vitals green without the trial and error?
I optimize Elementor sites until they pass Core Web Vitals on real visitors. Book a free call or browse my recent project portfolio.
The exact metric-by-metric checklist I use to diagnose and fix LCP, INP, and CLS on Elementor sites, in priority order.
Get it free →This article was last reviewed and updated in June 2026 to reflect the latest Core Web Vitals thresholds and Elementor performance features.